U.S. flag

An official website of the United States government

Here’s how you know

Dot gov

Official websites use .gov
A .gov website belongs to an official government organization in the United States.

HTTPS

Secure .gov websites use HTTPS
A lock (LockA locked padlock) or https:// means you have safely connected to the .gov website. Share sensitive information only on official, secure websites.

  • Environmental Topics
  • Laws & Regulations
  • Report a Violation
  • About EPA
Contact Us

Grantee Research Project Results

2013 Progress Report: Using Advanced Statistical Techniques to Identify the Drivers and Occurrence of Historical and Future Extreme Air Quality Events in the United States from Observations and Models

EPA Grant Number: R835228
Title: Using Advanced Statistical Techniques to Identify the Drivers and Occurrence of Historical and Future Extreme Air Quality Events in the United States from Observations and Models
Investigators: Heald, Colette L. , Reich, Brian , Cooley, Dan , Hodzic, Alma , Gilleland, Eric , Brown, Barbara G
Current Investigators: Heald, Colette L. , Hodzic, Alma , Reich, Brian , Cooley, Dan
Institution: Massachusetts Institute of Technology , Colorado State University , National Center for Atmospheric Research , North Carolina State University
EPA Project Officer: Chung, Serena
Project Period: June 1, 2012 through May 31, 2015 (Extended to May 31, 2016)
Project Period Covered by this Report: June 1, 2013 through May 31,2014
Project Amount: $749,931
RFA: Extreme Event Impacts on Air Quality and Water Quality with a Changing Global Climate (2011) RFA Text |  Recipients Lists
Research Category: Air Quality and Air Toxics , Climate Change , Watersheds , Air , Water

Objective:

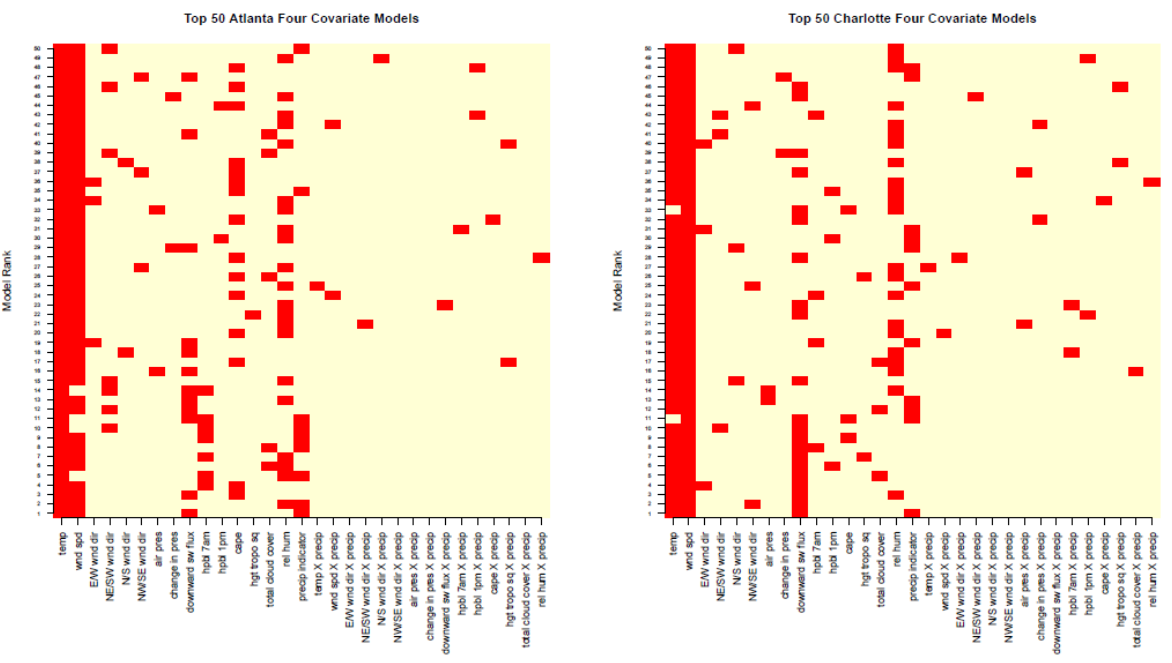
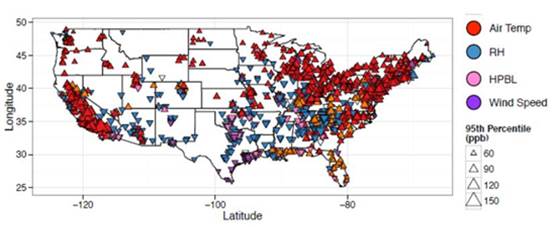
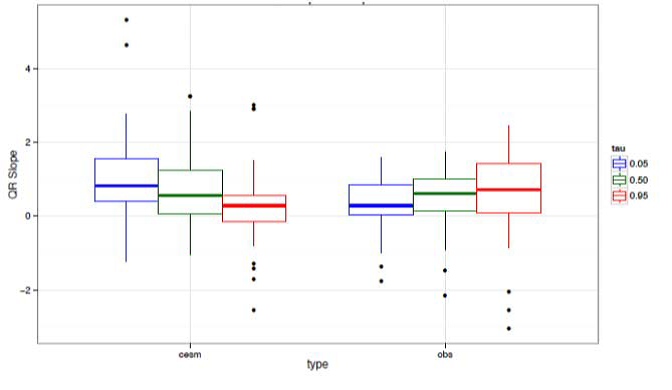
This second year of the project has focused on the application and further development of statistical methods initially investigated in Year 1. The extreme value theory methodology for air quality extremes developed by co-PI Dan Cooley’s group at CSU was finalized and applied to two case study cities in the United States. A manuscript describing these results was submitted, and the Cooley group now is exploring an expanded analysis based on this approach. The NCSU team led by Brian Reich has been working on spatial interpolation approaches for air quality extremes. The MIT team led by Colette Heald has been developing quantile regression approaches to compare air quality extremes in observations and models. This approach has been refined and applied to the ozone observational record in the United States and the global CESM climate model predictions for present-day. A manuscript describing these results is in preparation.

Progress Summary:

Extreme Value Analysis
The goal of the efforts led by the CSU team (in collaboration with the MIT and NCSU groups) is to understand the meteorological conditions that lead to extreme ground level ozone conditions. As ozone forms as a secondary pollutant from the combination of NOx and VOCs interacting with sunlight, it is well known that ozone is strongly correlated with both temperature and solar radiation. However, exploratory analysis shows that these covariates alone are not enough to distinguish a day with a high level of ozone from one where ozone is at its most extreme levels. Our work this year has been to fully develop and refine the method that was discussed in last year’s report. We provide details below.
 
Our proposed method relies on a framework provided by extreme value theory. Extreme value theory is the branch of statistics that specifically aims to characterize the upper tail. Specifically, we use a framework that allows us to characterize the tail dependence between variates. Typical dependence metrics such as correlation characterize dependence in the center of the distribution. However, dependence can change in different levels of the distribution and there are metrics better suited for measuring dependence in the tail.
 
We have devised a statistical method for performing data mining for extreme behavior. No such method previously existed. There are two pieces to our data mining procedure: the first involves maximizing the tail dependence between a set of covariates and the ozone response, and the second is a model selection procedure.
 
Our procedure to optimize the tail dependence finds the maximal tail dependence between all possible linear combination of meteorological covariates and the ozone response. To obtain convergence, the optimization procedure required that we use a smooth threshold that previously had not been considered in EVT. For statistical rigor, we found conditions on the amount of smoothing, which guarantee consistency of our estimator. A simulation study shows that our method, because it is tailored to address extreme behavior, outperforms other regression approaches such as linear regression, logistic regression, or quantile regression.
 
Figure 1
Figure 1: The covariates in the best 50 Atlanta (L) and Charlotte (R) four covariate models are reported. Models are ranked in terms of CV where the ranking of 1 corresponds to the best model. White indicates the absence of that particular covariate.
 
The model selection procedure aims to find which combination of covariates best describe the extreme behavior. The tail dependence metric focuses on the largest observations only (we are using the top 3%) and would be maximized if regression parameters could be found such that the concordance between the linear combination and the ozone completely agreed. We use a cross validation procedure, adapted to our measure of tail dependence, to perform model selection. A simulated annealing procedure allows for an automated search of the model space.
 
We have applied the method to ozone data from both Atlanta and Charlotte in order to compare responses from the two cities. Figure 1 shows the meteorological covariates that appear in the best scoring models. While the expected meteorological drivers of air temperature and wind speed appear in nearly all of the best scoring models, some other somewhat surprising meteorological drivers also seem to play a role in the most extreme ozone days. For example, precipitation appears in many of the best scoring models, and this is somewhat contrary to Jacob and Winner [2009] who found little effect on ground level ozone from precipitation. We also find that CAPE and relative humidity seem to be related to extreme ozone and this has spurred conversation within the project team about what role these meteorological variables play. The similar results from Atlanta and Charlotte give credence to the method.
 
A manuscript has been submitted to a top statistics journal. Work is underway to apply the method to a number of locations throughout two of EPA’s multistate regions and to interpret how the drivers of extreme air pollution vary by region.
 
 
Comparing Observed and Modeled Sensitivities of Ozone Air Quality Extremes to Meteorological Drivers
Over the last year, the MIT team (PI Colette Heald, and postdoc Dr. Will Porter) has focused on developing a robust, quantitative approach to characterizing the response of air quality to meteorological drivers that can be applied to both observations and models. We have been using quantile regression as a means of directly contrasting the response at either low, high, or median levels of ozone. This is also a relatively straight-forward method that does not require some of the extensive variable transformations and regularizations imposed, for example, by extreme value theory. The overall goals of this project are to determine: (1) to which meteorological drivers ozone responds most strongly, (2) how this differs for extreme ozone vs. median ozone levels, and (3) whether models reproduce the observed behavior.
 
Our objective here was to find a computationally efficient way of analyzing data from across the United States, but without pre-selecting for expected results. Thus, much of this past year has been dedicated to formalizing a variable selection approach. For each station across the United States, we started with a set of 30 meteorological parameters (e.g. surface temperature, wind speed, PBL height) as ozone predictors. For each of these parameters, we developed a suite of time horizons, these included both instantaneous (e.g. max daily), daily aggregates (e.g., 24-hr average, mean nighttime), or multi-day aggregates for the previous 3, 6, or 14 days. Then for each station, a variable selection algorithm was performed to filter out highly correlated variables, and assign rankings. Both quantile regression and random forest techniques were applied in this methodology. A final set of 8 meteorological variables was selected as either strong overall performers across the United States or as regionally critical parameters. These include temperature, RH, cloud cover, wind speed and PBL heights, at different time horizons. Figure 2 shows the primary drivers for 95th percentile surface ozone concentrations across the United States.
 
Figure 2
Figure 2: Primary drivers of observed 95th percentile summertime surface ozone concentrations
 
Multivariate quantile regression between surface ozone and these 8 meteorological drivers was then identically applied to the observed record at surface sites in the United States and a global climate model simulation. The relative importance of different meteorological drivers to predicting surface ozone is overall similar between model and observations. However, one very distinct behavior was revealed by this analysis. We found that while observations suggested that the highest ozone concentrations are most sensitive to temperature; the model shows the opposite behavior (sensitivity to temperature decreases with increasing ozone), see Figure 3.
 
Figure 3
Figure 3: Simulated with CESM (left) and observed (right) sensitivity of surface ozone to daily maximum temperature. The response is shown for low (5th, blue), median (green), and high (95th, red) quantiles of ozone. Higher QR slope indicates larger sensitivity.
 
This suggests that this chemistry-climate model is unlikely to predict the correct response in ozone to a warming climate, particularly in the case of the worst air quality events. Our initial model simulation was performed at 2 degree spatial resolution. A second higher resolution (1 degree) simulation shows identical results, indicating that this is unlikely to be the artefact of resolution. We also verified that this is not a result of shared co-variance (i.e., response to RH showing inverted sensitivities), nor that fire influence (a confounding factor which is difficult to characterize) plays a significant role in these results. The magnitude of this disagreement is significant when compared to the ozone response to climate change, and certainly would suggest an inadequate representation of the so-called “climate penalty.” We are currently investigating whether the CMIP and ACCMIP archive can provide enough information from previous chemistry-climate simulations for us to repeat this analysis for other models. Consistency across models in the failure to reproduce the temperature response of ozone would indicate a major deficiency in chemistry-climate modeling. We plan to summarize these results and our methods in 1-2 manuscripts in the coming 6 months.
 
 
Spatial Analysis
The NCSU team continued work on spatial statistical modelling of air pollution using both data and models. In Reich et al (2014), we apply statistical methods to combine both data and CMAQ output to reconstruct ozone concentrations throughout the US. Complex computer models play a crucial role in air quality research. These models are used to evaluate potential regulatory impacts of emission control strategies and to estimate air quality in areas without monitoring data. For both of these purposes, it is important to calibrate model output with monitoring data to adjust for model biases and improve spatial prediction. In this article, we propose a new spectral method to study and exploit complex relationships between model output and monitoring data. Spectral methods allow us to estimate the relationship between model output and monitoring data separately at different spatial scales, and to use model output for prediction only at the appropriate scales. The proposed method is computationally efficient and can be implemented using standard software. We apply the method to compare Community Multiscale Air Quality (CMAQ) model output with ozone measurements in the United States in July 2005. We find that CMAQ captures large-scale spatial trends, but has low correlation with the monitoring data at small spatial scales.
 
In addition, Sam Morris continues to develop new methods for spatial interpolation of extremes. His approach uses skew-t spatial model to capture dependence between extreme events at nearby locations. Simulation studies verify that this approach is both computationally efficient and competitive with existing methods. We are now beginning to apply this new methods to model ozone in the southeastern United States. He recently presented preliminary work at the Joint Statistical Meetings in Boston, MA.
 
In previous work, Reich and Shaby (2012) developed a new approach to analyzing spatial extremes. The proposed max-stable process model is shown to improve interpolation of extreme events. Sun et al., (2015) focused on identifying spatial regions with decreasing trends in their extreme ozone concentrations. The proposed method is able to flag sites with changing ozone extremes while maintaining proper false discovery rate.

Future Activities:

In the coming year, we anticipate the final publication of the CSU team’s paper describing the extreme value analysis methods. This will be followed by a broader application of this methodology to U.S. wide air quality, with an accompanying publication.
 
The MIT team expects to complete the quantile regression comparison of ozone response to meteorological drivers in observations and global climate models, culminating in a journal publication. Dr. Will Porter will be giving a plenary presentation on this work at the IGAC Conference in Natal, Brazil in September 2014, and will also be representing the team at the AGU Conference special session on Extremes in December 2014. The MIT team will then move on to the analysis of particulate matter extremes in the final year of this project, again using both observations and models.
 
In parallel, the NCSU team will complete the spatial extremes paper described above. The NCSU team will also begin to work on the fundamental issue of selecting a threshold above which observations are deemed to be "extreme," which has the potential to have a broad impact on the extremes literature.
 
In January, the NCAR team will begin investigating whether or not the knowledge and statistical relationships learned from the results of the global model (coarse resolution) also hold for the meso-scale model. For that we will use the already existing WRF-Chem simulations (for 13 summers in the past 1996-2008, and for the future 2056-2058 performed at 12km horizontal resolution). We will contrast the present vs future results. As the meso-scale model simulations were performed using the meteorological reanalysis, we will also further look at the bivariate relationships in terms of the very extreme values of the processes between the model output and observations.

References:

Jacob DJ, Winner DA. Effect of climate change on air quality. Atmospheric Environment 2009;43(1):51-63, doi:10.1016/j.atmosenv.2008.09.051.


Journal Articles on this Report : 5 Displayed | Download in RIS Format

Publications Views
Other project views: All 38 publications 12 publications in selected types All 12 journal articles
Publications
Type Citation Project Document Sources
Journal Article Reich BJ, Shaby BA. A hierarchical max-stable spatial model for extreme precipitation. Annals of Applied Statistics 2012;6(4):1430-1451. R835228 (2013)
R835228 (2014)
R835228 (Final)
  • Full-text from PubMed
  • Abstract from PubMed
  • Associated PubMed link
  • Full-text: Project Euclid-Full Text PDF
    Exit
  • Abstract: Project Euclid-Abstract
    Exit
  • Other: NC State University-Full Text PDF
    Exit
  • Journal Article Reich BJ, Chang HH, Foley KM. A spectral method for spatial downscaling. Biometrics 2014;70(4):932-942. R835228 (2013)
    R835228 (2014)
    R835228 (Final)
    R834799 (2014)
    R834799 (2015)
    R834799 (2016)
    R834799 (Final)
  • Full-text from PubMed
  • Abstract from PubMed
  • Associated PubMed link
  • Full-text: Europe PMC-Full Text HTML
    Exit
  • Abstract: Wiley-Abstract
    Exit
  • Other: ResearchGate-Full Text PDF
    Exit
  • Journal Article Reich B, Cooley D, Foley K, Napelenok S, Shaby B. Extreme value analysis for evaluating ozone control strategies. Annals of Applied Statistics 2013;7(2):739-762. R835228 (2012)
    R835228 (2013)
    R835228 (2014)
    R835228 (Final)
  • Full-text from PubMed
  • Abstract from PubMed
  • Associated PubMed link
  • Full-text: Project Euclid-Full Text PDF
    Exit
  • Abstract: Project Euclid-Abstract
    Exit
  • Other: NC State University-Full Text PDF
    Exit
  • Journal Article Russell BT, Cooley DS, Porter WC, Reich BJ, Heald CL. Data mining to investigate the meteorological drivers for extreme ground level ozone events. Annals of Applied Statistics 2016;10(3):1673-1698. R835228 (2013)
    R835228 (Final)
  • Full-text: arXiv.org-Full Text (prepublication)
    Exit
  • Abstract: Project Euclid-Abstract
    Exit
  • Other: ResearchGate-Abstract
    Exit
  • Journal Article Sun W, Reich BJ, Cai TT, Guindani M, Schwartzman A. False discovery control in large-scale spatial multiple testing. Journal of the Royal Statistical Society: Series B, Statistical Methodology 2015;77(1):59-83. R835228 (2013)
    R835228 (2014)
    R835228 (Final)
  • Full-text from PubMed
  • Abstract from PubMed
  • Associated PubMed link
  • Full-text: University of Pennsylvania-Full Text PDF
    Exit
  • Abstract: Wiley Online-Abstract
    Exit
  • Supplemental Keywords:

    ozone, particulate matter, extreme value analysis, quantile regression, air quality, CESM

    Progress and Final Reports:

    Original Abstract
  • 2012 Progress Report
  • 2014 Progress Report
  • Final Report
  • Top of Page

    The perspectives, information and conclusions conveyed in research project abstracts, progress reports, final reports, journal abstracts and journal publications convey the viewpoints of the principal investigator and may not represent the views and policies of ORD and EPA. Conclusions drawn by the principal investigators have not been reviewed by the Agency.

    Project Research Results

    • Final Report
    • 2014 Progress Report
    • 2012 Progress Report
    • Original Abstract
    38 publications for this project
    12 journal articles for this project

    Site Navigation

    • Grantee Research Project Results Home
    • Grantee Research Project Results Basic Search
    • Grantee Research Project Results Advanced Search
    • Grantee Research Project Results Fielded Search
    • Publication search
    • EPA Regional Search

    Related Information

    • Search Help
    • About our data collection
    • Research Grants
    • P3: Student Design Competition
    • Research Fellowships
    • Small Business Innovation Research (SBIR)
    Contact Us to ask a question, provide feedback, or report a problem.
    Last updated April 28, 2023
    United States Environmental Protection Agency

    Discover.

    • Accessibility
    • Budget & Performance
    • Contracting
    • EPA www Web Snapshot
    • Grants
    • No FEAR Act Data
    • Plain Writing
    • Privacy
    • Privacy and Security Notice

    Connect.

    • Data.gov
    • Inspector General
    • Jobs
    • Newsroom
    • Open Government
    • Regulations.gov
    • Subscribe
    • USA.gov
    • White House

    Ask.

    • Contact EPA
    • EPA Disclaimers
    • Hotlines
    • FOIA Requests
    • Frequent Questions

    Follow.