U.S. flag

An official website of the United States government

Here’s how you know

Dot gov

Official websites use .gov
A .gov website belongs to an official government organization in the United States.

HTTPS

Secure .gov websites use HTTPS
A lock (LockA locked padlock) or https:// means you have safely connected to the .gov website. Share sensitive information only on official, secure websites.

  • Environmental Topics
  • Laws & Regulations
  • Report a Violation
  • About EPA
Contact Us

Grantee Research Project Results

2013 Progress Report: Exposure Mapping – Characterization of Gases and Particles for ExposureAssessment in Health Effects and Laboratory Studies

EPA Grant Number: R834796C001
Subproject: this is subproject number 001 , established and managed by the Center Director under grant R834796
(EPA does not fund or establish subprojects; EPA awards and manages the overall grant for this center).

Center: University of Washington Center for Clean Air Research
Center Director: Vedal, Sverre
Title: Exposure Mapping – Characterization of Gases and Particles for ExposureAssessment in Health Effects and Laboratory Studies
Investigators: Yost, Michael , VanReken, Timothy M. , Jobson, B. Thomas , Larson, Timothy V. , Simpson, Chris
Institution: University of Washington , Washington University
EPA Project Officer: Callan, Richard
Project Period: December 1, 2010 through November 30, 2015 (Extended to November 30, 2017)
Project Period Covered by this Report: December 1, 2012 through November 30,2013
RFA: Clean Air Research Centers (2009) RFA Text |  Recipients Lists
Research Category: Air Quality and Air Toxics , Air

Objective:

Roadway-source air pollutants encompass a diversity of chemicals, including both particulate and gas phase components that are transformed by chemical and physical reactions as they age in the environment. Consequently, human exposures to air pollutants can range from relatively un-aged to highly aged components that vary with respect to particle size and the chemical composition of particle and gas phase components. To obtain a more comprehensive understanding of the seasonal and spatial variability in the concentration and composition of air pollutant exposures within MESA-Air cities, we employ mobile and fixed site monitoring to assess both gas and particle components of these pollutants as they age from roadway sources to population areas.
 
The main project objectives are to:
  1. Characterize spatial and temporal gradients of selected air pollutants along roadways and within neighborhoods in MESA cities using a mobile platform.
  2. Measure spatial variation in concentrations of selected air pollutants at 2-week average stationary sites in coordination with the mobile measurements.
  3. Characterize aging of air pollutant components as they are transported from roadway sources to neighborhood receptor locations.
  4. Provide detailed characterization of laboratory exposure conditions available for toxicology testing, and identify likely conditions that mimic those found in urban settings.

Progress Summary:

Aims 1 and 2 continue as the main focus of activities in this year 3 time period. This phase of the study is conducting field sampling through 2013 across four cities in the MESA-Air cohort: Minneapolis/St. Paul, MN; Baltimore, MD; Los Angeles, CA; and Winston-Salem, NC. Due to financial constraints, a decision was made by the Center leadership that Winston-Salem will only be monitored with passive samplers. The instrument platform for mobile monitoring was assembled and tested in Seattle in October of 2011. Mobile monitoring and passive sampling measurements for both heating and non-heating seasons have been completed in Minneapolis/St. Paul, Baltimore and Los Angeles. During each 2-week sampling period, the mobile monitoring platform measures concentrations of particles and gases while continuously on the move along a fixed sampling route with position information simultaneously logged by real-time GPS. Data collection includes the following components: optical particle size in 31 size bins from 10 to 0.2 μm, particle mean diameter and particle count from 0.03 to 0.2 μm, total particle count >0.1 μm, particle light scattering coefficient, particle light absorption (black carbon), NO/NO2, O3, CO, CO2 and total VOCs.
 
Pre-planned driving routes were created for each city, arranged into three sectors with 14 measurement intersection waypoints in each sector for measurement, plus a common central reference site. These 43 waypoints were selected in advance, based on a set of route criteria developed in consultation with the Biostatistics Core of the Center. The routes were evaluated by the Biostatistics Core for use in the spatial mapping of exposures later in the study. Based on advice from our advisory committee, we also developed a more intensive “roadway gradient” sampling scheme, which modified one of the waypoints. This gradient sampling scheme was pilot tested during our field visit to Albuquerque, NM, and the results are shown in Figure 1 below. Similar gradient samples were collected in all cities where mobile monitoring was conducted.
 

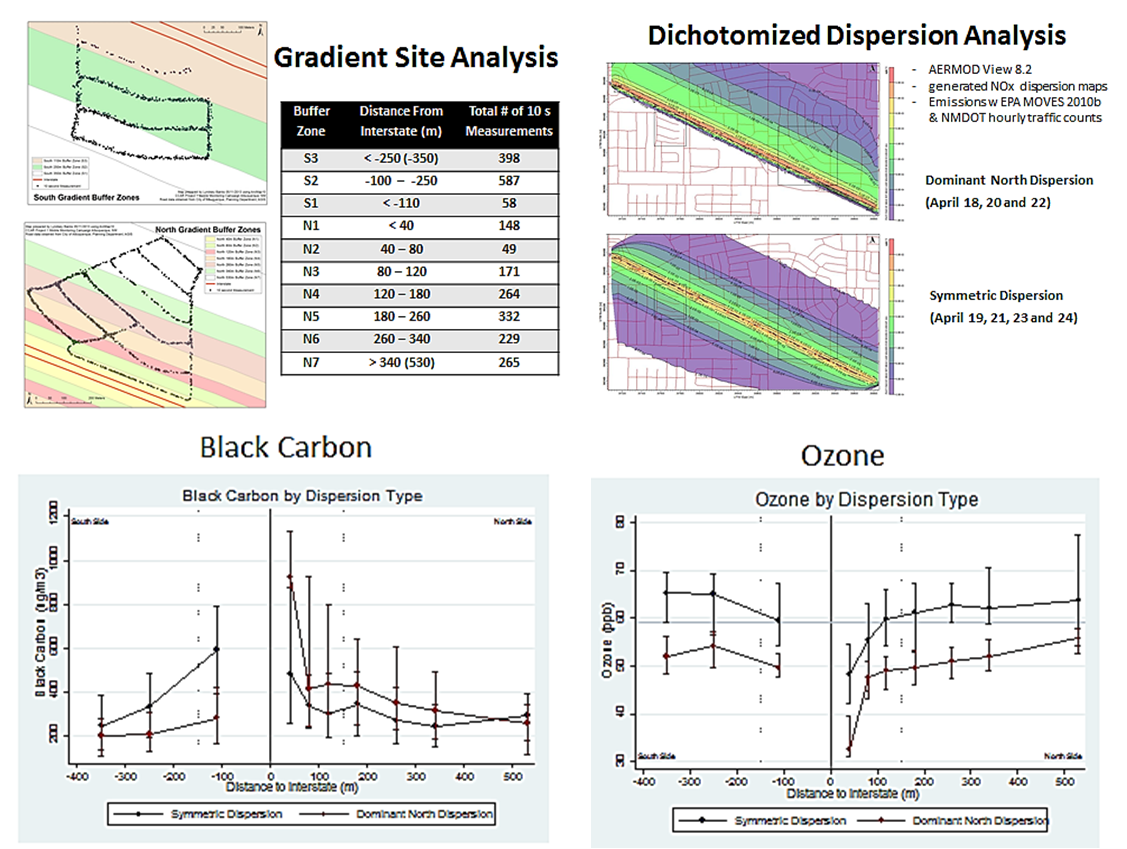
Figure 1 - Gradient sampling Data Collected in Albuquerque, NM

Figure one shows results from our gradient sampling tests in Albuquerque, NM, over a 1-week period during May 2012. Mobile monitoring was used to repeatedly sample multi-pollutants near a major interstate roadway (I-40). The 10 sec mobile data collected near the interstate was classified into buffers corresponding to different distances from the centerline of the interstate.
 
Next, AERMOD was used to evaluate the dispersion condition near the roadway during the specific days and time that mobile sampling was done. Two major dispersion conditions were identified: a dominant north-side dispersion pattern with winds coming from the south; and a symmetric dispersion condition during more stagnant conditions. Three sampling days corresponded to the dominant north-side pattern (shown in red), and 4 days corresponded to the symmetric pattern (shown in blue). The data shown represent the median and interquartile range (error bars) for buffer distance over the 7-day period, classified by the dispersion conditions. The data for black carbon (absorbance) and ozone quite clearly show that the instruments capture the near roadway gradient, and also illustrate the effect of dispersion conditions on the shape of the gradient. The mobile sampling also clearly captures the near road deficit in ozone, which is likely due to NO/NOx scavenging.
 
Similar patterns in ozone and NO/NOx have been observed in larger scale sampling with both our passive samplers and mobile platform in the other cities. Note that the mobile data only are collected during the evening commute, while the passive badges collect continuously over the 2-week period. Because the mobile platform is often collected during peak traffic and ozone periods, it may more clearly capture these near roadway effects showing an interaction of the multipollutants. 
 
Preliminary multivariate analysis of the mobile platform data was done using pilot measurements in Seattle. Traditional PCA with varimax rotation was examined, and the resultant factor scores were compared with a photographic record using an onboard camera.

* Factor variable loadings from PCA analysis (see text for variable list)
** Peak events identified from factor scores plotted as a time series
*** Images from onboard video corresponding to peak event for this factor
 
Figure 2 - Results of PCA analysis with Varimax rotation from Duwamish Pilot study.
 
The results shown in Figure 2 indicate that there are strong latent variables that are logically related to specific roadway sources. We are currently examining whether these features are observed in our MESA cities data.
 
In the figure, the second column shows factor loadings from a PCA analysis of 10-second mobile monitoring data collected on one afternoon during the pilot study. The measured variables on the horizontal axis from left to right are: NO, NOx, black carbon via aethalometer, UV channel on aethalometer, VOCs, particle number concentration via P-trak, light scattering coefficient with integrating nephelometer, O3, particle bound PAHs, CO, and total particle volume concentration within the following optical particle diameter size ranges : >0.2-0.4, >0.4-1.0, >1.0-3.0, >3.0 to 10 micrometers.
 
The third column shows a time series of the factor score for each factor in the PCA analysis. The labeled peaks correspond to the following events as determined by an onboard camera (events labeled in bold letters correspond to the pictures shown in the fourth column): {A} at red light behind truck; {B} behind truck under freeway; {C} following school bus; {D} at red light behind school bus; {E} truck passing uphill; {F} in uphill traffic; {G & H} roadside next to uphill traffic; {J} sample inlet adjustments (experimental artifact); {K} behind large vehicle; {L} dust plume from off-road truck; {M} next to minivan uphill; {N} idling vehicle; {P} idling pickup truck; {Q} industrial site (no CO observed); {R} residential street; {S} traffic pulse after stop light.
 
The fourth column shows pictures taken with an onboard camera at time of the peak event identified by the factor score time series. These video images help to clarity the interpretation of the factor loadings, in terms of possible on-road sources of multi-pollutants. Further work is under way to extend this analysis to longer time scales and to integrate additional information collected during the mobile sampling campaigns.
 
In pursuance of Objective 4, detailed chemical characterization measurements were made of controlled exposure atmospheres at LRRI in May 2012. Over the course of 3 weeks, nearly 50 distinct exposure atmospheres were sampled. The majority of these test atmospheres were composed of unaged gasoline and diesel exhaust at various loadings and degrees of mixing; a few atmospheres were also sampled where the emissions were photochemically aged prior to sampling. All test atmospheres were sampled by the same instrument platform used for the mobile sampling.
 
Additionally, the WSU collaborators sampled the test atmospheres with a high resolution timeof-flight aerosol mass spectrometer (HR-ToF-AMS) and a proton transfer reaction mass spectrometer (PTR-MS). The PTR-MS was coupled with a thermal desorption system for analyzing organic compounds with intermediate volatility (IVOCs). The HR-AMS and PTR-MS provided a much more detailed characterization of the particle- and gas-phase organic composition of the test atmospheres, which will yield improved understanding of the chemical characteristics and phase partitioning behavior of exhaust mixtures. Preliminary results from the experiments at LRRI were presented at the CLARC annual meeting, and a manuscript has been recently submitted for review on the thermal desorption PTR-MS sampling methodology describing some results from LRRI exposure chamber sampling.
 
One result from the test chamber sampling is that it seems possible to quantify the relative amounts of diesel and gasoline exhaust in the mixture from analysis of IVOC compound distribution. Significant differences exist between gasoline and diesel engine exhaust IVOC compound abundance, allowing for a chemical mass balance approach to determine relative contributions as shown in Figure 3. This analysis is useful for exposure chamber experiments and may be usefully applied to ambient air monitoring to better quantify the role of diesel engine emissions in organic compound concentrations in urban air.
 
Additional work was performed this year in determining PTR-MS fragmentation patterns for organic compounds found in vehicle exhausts, and a manuscript is currently being written for submission to a journal this fall. Detailed analysis is ongoing combining results from the PTRMS and HR-ToF-AMS to examine if gas to particle partitioning of organic constituents can be observed in the data. Multiple publications and presentations are expected in the coming year.
 
 
Figure 3 - PTR-MS data showing relative abundance of ion signals to m/z 135 (C4-alkylbenzene compounds) for pure diesel (red circle) and gasoline (blue square) exhaust and a mixture of the two (green diamonds). The relative abundance of the mixture can be well estimated (dashed line) from the fractional contributions of each exhaust. Colored bars indicate different compound groups: alkenes (grey), cycloalkenes (green), bicycloalkanes (orange), alkylbenzenes (blue), naphthenic monoaromatics (red), naphthalenes (turquoise), and C10-C17 alkanes (black).
 
Relatively few problems have been encountered to date that have required any modifications in the project aims. After consulting with the Biostatistical Core, we determined that more passive samplers were needed to provide an adequate description of spatial variability in pollutants, and to reflect study subject residence concentrations. The main change has been to expand the number of passive samplers from 20 to 43 in each city. A standardized vehicle platform also was needed to improve logistics of the field sampling and to improve data QC. We attempted to use a hybrid vehicle to enable a more accurate measurement of roadway pollutants in traffic. However, this was not possible because most rental companies either do not offer a hybrid or have very few available. The same make/model vehicle (Ford Escape) is rented in each city during the measurement sessions.


Future Activities:

Activities in the next year will focus on analysis of data from the field sampling campaigns, completing the chamber characterization studies, and assembling the data set for further analysis.
 
We have completed most of the field work on target and will be conducting a cross-center collaboration study with the SCAPE Center in Atlanta in September of 2013, using the mobile platform. We also have scheduled the chamber characterization studies in Seattle/UW for October–November of this year. Data cleaning and QC review are under way for the cities that already have been sampled, and working with the Biostatistics Core, we have partially automated the data QC and review process. Work on publications and dissemination of results for the first year of measurements is under way and nearly ready.


Journal Articles on this Report : 1 Displayed | Download in RIS Format

Publications Views
Other subproject views: All 43 publications 18 publications in selected types All 18 journal articles
Other center views: All 197 publications 94 publications in selected types All 93 journal articles
Publications
Type Citation Sub Project Document Sources
Journal Article Erickson MH, Gueneron M, Jobson BT. Measuring long chain alkanes in diesel engine exhaust by thermal desorption PTR-MS. Atmospheric Measurement Techniques. 2014;7(1):225-239. R834796 (2013)
R834796 (Final)
R834796C001 (2013)
  • Full-text: AMT-Full Text PDF
    Exit
  • Abstract: AMT-Abstract
    Exit
  • Other: Harvard University-Abstract
    Exit
  • Supplemental Keywords:

    Exposure science, community exposures, chemical transport, mobile monitoring, Scientific Discipline, Health, Air, ENVIRONMENTAL MANAGEMENT, Air Quality, air toxics, Health Risk Assessment, Risk Assessments, mobile sources, Environmental Monitoring, Biochemistry, Atmospheric Sciences, Risk Assessment, ambient air quality, atmospheric particulate matter, particulate matter, aerosol particles, air pollutants, motor vehicle emissions, vehicle emissions, air quality models, motor vehicle exhaust, airway disease, bioavailability, air pollution, particle exposure, atmospheric aerosols, ambient particle health effects, vascular dysfunction, cardiotoxicity, atmospheric chemistry, exposure assessment

    Relevant Websites:

    http://depts.washington.edu/uwccar/

    Progress and Final Reports:

    Original Abstract
  • 2011 Progress Report
  • 2012 Progress Report
  • 2014
  • 2015 Progress Report
  • 2016 Progress Report
  • Final Report

  • Main Center Abstract and Reports:

    R834796    University of Washington Center for Clean Air Research

    Subprojects under this Center: (EPA does not fund or establish subprojects; EPA awards and manages the overall grant for this center).
    R834796C001 Exposure Mapping – Characterization of Gases and Particles for ExposureAssessment in Health Effects and Laboratory Studies
    R834796C002 Simulated Roadway Exposure Atmospheres for Laboratory Animal and Human Studies
    R834796C003 Cardiovascular Consequences of Immune Modification by Traffic-Related Emissions
    R834796C004 Vascular Response to Traffic-Derived Inhalation in Humans
    R834796C005 Effects of Long-Term Exposure to Traffic-Derived Particles and Gases on Subclinical Measures of Cardiovascular Disease in a Multi-Ethnic Cohort

    Top of Page

    The perspectives, information and conclusions conveyed in research project abstracts, progress reports, final reports, journal abstracts and journal publications convey the viewpoints of the principal investigator and may not represent the views and policies of ORD and EPA. Conclusions drawn by the principal investigators have not been reviewed by the Agency.

    Project Research Results

    • Final Report
    • 2016 Progress Report
    • 2015 Progress Report
    • 2014
    • 2012 Progress Report
    • 2011 Progress Report
    • Original Abstract
    43 publications for this subproject
    18 journal articles for this subproject
    Main Center: R834796
    197 publications for this center
    93 journal articles for this center

    Site Navigation

    • Grantee Research Project Results Home
    • Grantee Research Project Results Basic Search
    • Grantee Research Project Results Advanced Search
    • Grantee Research Project Results Fielded Search
    • Publication search
    • EPA Regional Search

    Related Information

    • Search Help
    • About our data collection
    • Research Grants
    • P3: Student Design Competition
    • Research Fellowships
    • Small Business Innovation Research (SBIR)
    Contact Us to ask a question, provide feedback, or report a problem.
    Last updated April 28, 2023
    United States Environmental Protection Agency

    Discover.

    • Accessibility
    • Budget & Performance
    • Contracting
    • EPA www Web Snapshot
    • Grants
    • No FEAR Act Data
    • Plain Writing
    • Privacy
    • Privacy and Security Notice

    Connect.

    • Data.gov
    • Inspector General
    • Jobs
    • Newsroom
    • Open Government
    • Regulations.gov
    • Subscribe
    • USA.gov
    • White House

    Ask.

    • Contact EPA
    • EPA Disclaimers
    • Hotlines
    • FOIA Requests
    • Frequent Questions

    Follow.