
Grantee Research Project Results
2015 Progress Report: Effects of Long-Term Exposure to Traffic-Derived Particles and Gases on Subclinical Measures of Cardiovascular Disease in a Multi-Ethnic Cohort
EPA Grant Number: R834796C005Subproject: this is subproject number 005 , established and managed by the Center Director under grant R834796
(EPA does not fund or establish subprojects; EPA awards and manages the overall grant for this center).
Center: Predictive Toxicology Center for Organotypic Cultures and Assessment of AOPs for Engineered Nanomaterials
Center Director: Faustman, Elaine
Title: Effects of Long-Term Exposure to Traffic-Derived Particles and Gases on Subclinical Measures of Cardiovascular Disease in a Multi-Ethnic Cohort
Investigators: Kaufman, Joel D. , Sheppard, Lianne (Elizabeth) A. , Larson, Timothy V. , Szpiro, Adam , Yost, Michael , Sampson, Paul , Vedal, Sverre
Current Investigators: Vedal, Sverre , Sheppard, Lianne (Elizabeth) A. , Kaufman, Joel D. , Larson, Timothy V. , Szpiro, Adam , Yost, Michael , Sampson, Paul
Institution: University of Washington
EPA Project Officer: Callan, Richard
Project Period: December 1, 2010 through November 30, 2015 (Extended to November 30, 2017)
Project Period Covered by this Report: August 1, 2014 through July 31,2015
RFA: Clean Air Research Centers (2009) RFA Text | Recipients Lists
Research Category: Human Health , Air
Objective:
Project 5 has three primary objectives, which are unchanged from those described previously:
Aim 1: Employ the small-scale gradient data acquired as part of the mobile monitoring campaign in Project 1 in conjunction with central fixed-site data, regulatory monitoring data and geographic covariates to build a multipollutant exposure model for traffic-derived air pollutants. This model will incorporate complex spatial information on primary and secondary traffic-derived particles and gases.
Aim 2: Develop and validate individual-level exposure estimates for traffic-derived air pollutants, integrating (1) the outdoor residential concentration estimates from the multipollutant model; (2) estimates of residential infiltration rates; (3) road class- and traffic-condition-specific estimates of on-roadway concentrations; and (4) individual-level questionnaire-derived time-location information. These individual-level exposure estimates will also utilize personal monitoring data designed to clarify the in-transit component of total exposure.
Aim 3: Estimate the effect of individual-level exposure to traffic-derived air pollution on subclinical cardiovascular disease using these exposure models. Health outcomes will include left ventricular myocardial mass as ascertained by MRI, arteriolar diameters as measured by retinal photography, coronary artery calcium as ascertained by CT, intima-medial thickness as measured by ultrasound, and DNA methylation.
Progress Summary:
Aim 1: Developing spatial exposure model
For Aim 1 of Project 5, we are working closely with Project 1 and Biostatistics Core personnel to develop approaches to their high-dimensional data that can be applied to epidemiological analyses. We plan to use cluster membership as an effect modifier for the health analyses of the association between NO2 exposure and measurements of coronary artery calcium (CAC). We have assigned clusters using predictive k-means clustering for each of the four cities sampled as part of Project 1.
Baltimore, MD
Results for the cluster analysis in Baltimore are presented in Figure 1 and Figure 2. The pollutants included in the analysis have been normalized by the NOx concentration measured at each of the 43 sampling locations. The spatial categorization between the winter and summer seasons differ, although there is some similarity (Rand Index of 0.6 representing moderate agreement). In both the winter and summer sampling periods, we identify a cluster that represents low proportions of all the measured pollutants per ppb of measured NOx. This likely corresponds to locations with smaller contribution of local-traffic-related pollutants (Cluster 1 for both seasons). Another common profile between summer and winter months is the identification of clusters representing a higher proportion of low molecular weight volatile organic compounds (VOCs) per ppb of NOx in combination with a lower proportion of particle counts and higher molecular weight VOCs. This likely corresponds to locations where there is a higher proportion of local car traffic compared to heavier-duty diesel vehicles. Cluster 3 in the winter shows higher proportions of particle counts and higher molecular weight VOCs, likely corresponding to locations with higher local truck traffic. In the summer, Cluster 3 seems to capture locations that are more highly impacted by secondary air pollutants, as evidenced by the higher proportion of NO2, O3, and particles compared to NOx. Cluster 4 represents locations with a higher proportion of heavier molecular weight VOCs and particles, again likely to be related to higher diesel traffic in these locations. The overall proportions, though, differ from the winter profile, perhaps due to differences in ambient temperature. The last summer cluster, Cluster 5, represents two outlier locations characterized by extremely high proportions of VOCs. These two locations are located in close spatial proximity to each other, suggesting they are impacted by the same unidentified source.

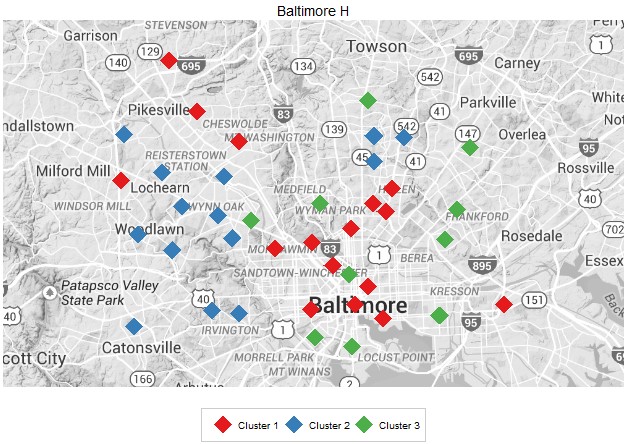
Figure 1. Baltimore, winter: Cluster-specific z-score of normalized pollutant concentrations and spatial distribution of clusters.
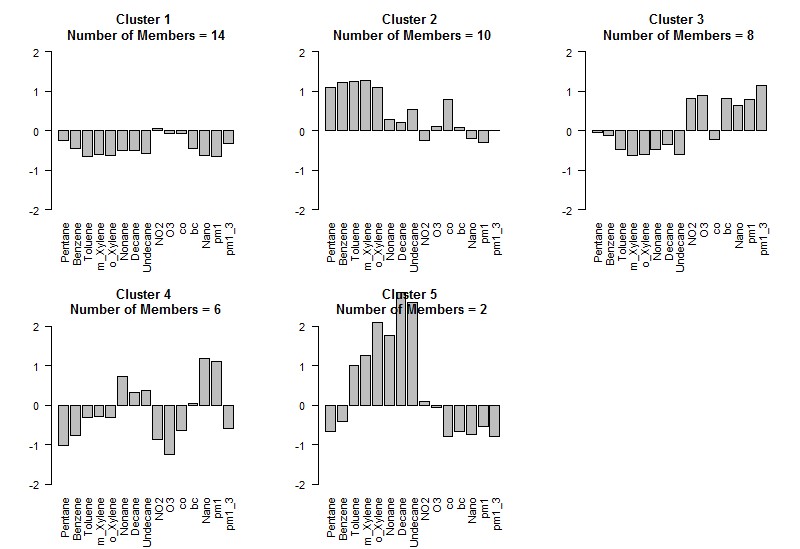
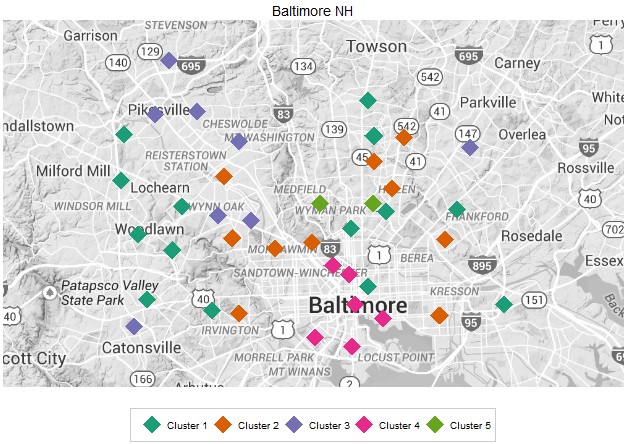
Figure 2. Baltimore, summer: Cluster-specific z-score of normalized pollutant concentrations and spatial distribution of clusters.
Los Angeles, CA
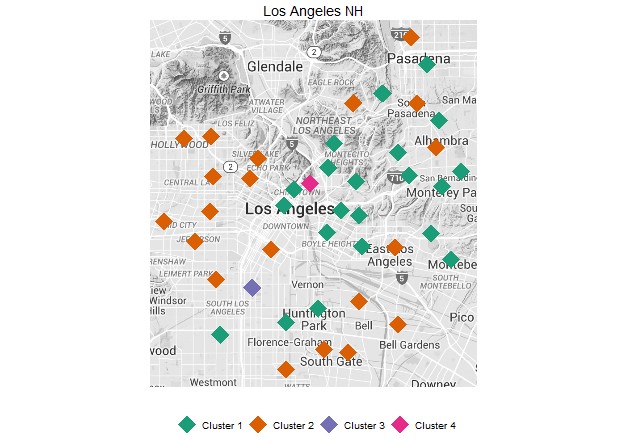
Results for the cluster analysis in Los Angeles are presented in Figure 3 and Figure 4. Similar to the result in Baltimore, both the composition and spatial distribution of the clusters vary by season. The spatial distribution between the seasons is only moderately comparable (Rand index of 0.6). One location (the intersection of East 47th Place and Wall Street) emerges as an extreme outlier in both seasons, with high proportions of high molecular weight VOCs, although the reason for this is unclear simply based on geography and point source locations. Similar to Baltimore, in both seasons there is a cluster that is characterized by low proportions of most measured pollutants, likely corresponding to lower local traffic locations (Cluster 1). In the summer, this cluster does show some contribution of particles. The second cluster in both seasons appears to indicate higher proportion of gas vehicle traffic based on the higher proportion of low molecular weight VOCs and lower proportion of particles. In the winter, a clear diesel-related cluster emerges (Cluster 3) that is not apparent during the summer sampling period.
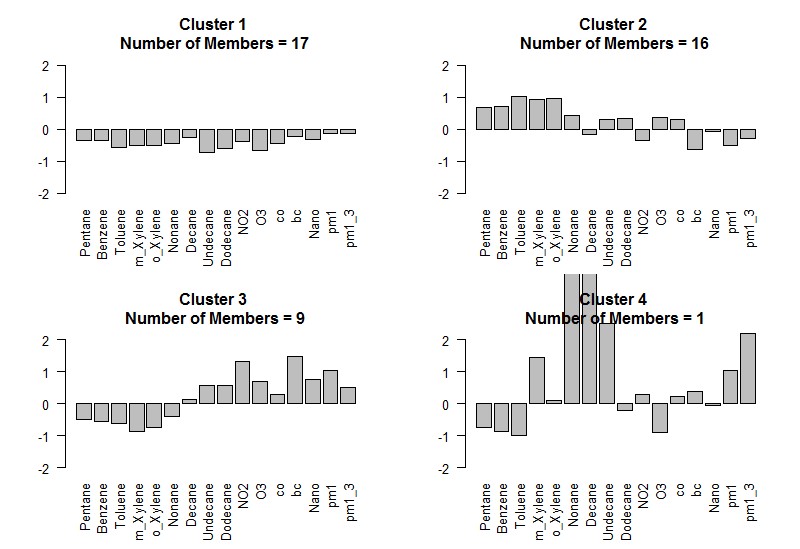
Figure 3. Los Angeles, winter: Cluster-specific z-score of normalized pollutant concentrations and spatial distribution of clusters.
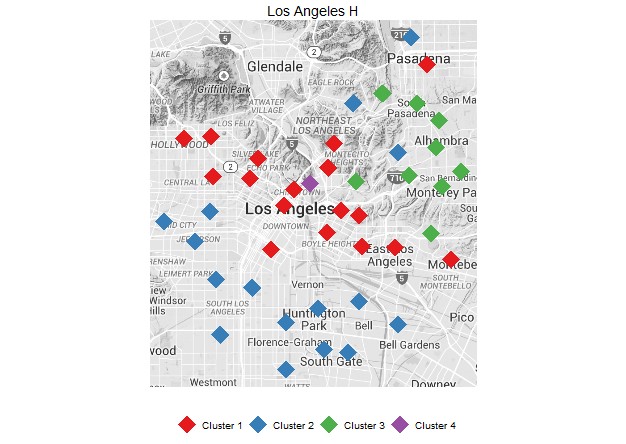

Figure 4. Los Angeles, summer: Cluster-specific z-score of normalized pollutant concentrations and spatial distribution of clusters.
St. Paul, MN, and Winston-Salem, NC
For both St. Paul and Winston-Salem, clustering was applied to only the passive sampling data. Because there was a lack of information on particle composition for these sites, the interpretation of the clustering results is more limited. In St. Paul, for both seasons we observe clusters with a higher proportion of low molecular weight VOCs, perhaps indicating higher proportion of car traffic at these locations (similar to the observations in Los Angeles and Baltimore). This type of cluster does not emerge in Winston-Salem. In addition, we observe for both these cities locations with lower proportions of all measured pollutants that emerge distinctly from other sampling locations.

Figure 5. St. Paul, winter: Cluster-specific z-score of normalized pollutant concentrations and spatial distribution of clusters.

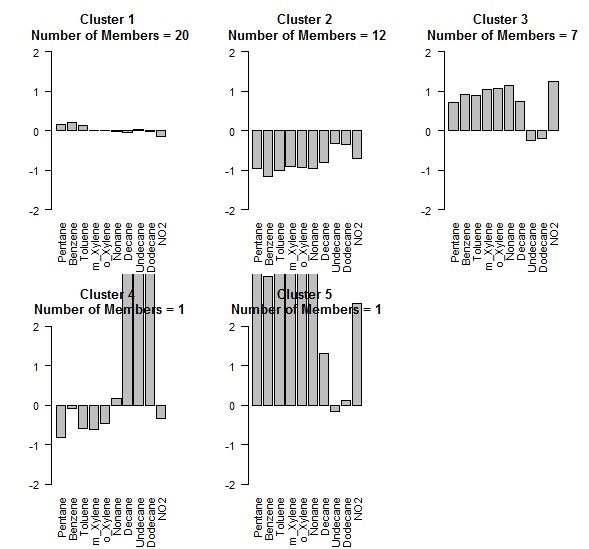
Figure 6. St. Paul, summer: Cluster-specific z-score of normalized pollutant concentrations and spatial distribution of clusters.
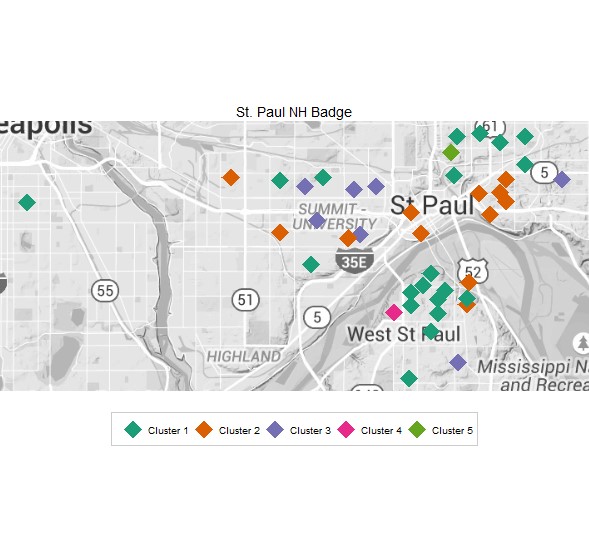
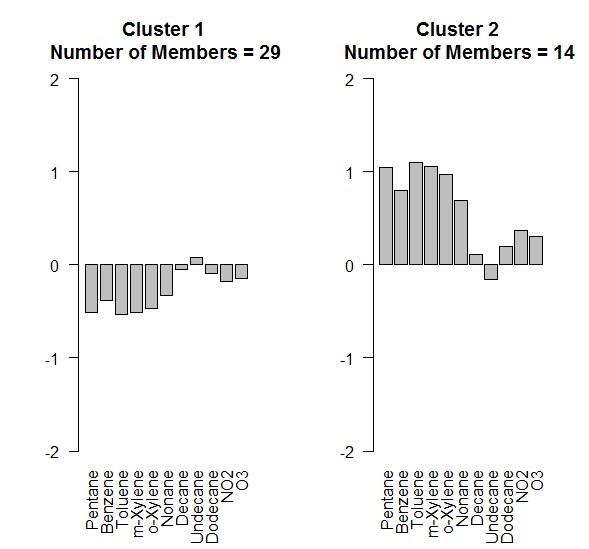
Figure 7. Winston-Salem, winter: Cluster-specific z-score of normalized pollutant concentrations and spatial distribution of clusters.


Figure 8. Winston-Salem, summer: Cluster-specific z-score of normalized pollutant concentrations and spatial distribution of clusters.

Aim 2: Understanding in-vehicle contribution to individual-level multipollutant exposures
A major effort has been in the field work portion of this project, which will address significant portions of the second aim of this project. Specifically, through a combination of personal, residential and in-vehicle sampling, paired with intensive location tracking, we are seeking to understand the influence of time spent in transit on personal exposure, which will improve our individual-level exposure estimates and contribute to our epidemiological analysis.
All four exposure campaigns have been completed. These campaigns occurred twice in two seasons each in Winston-Salem and Los Angeles and involved individual-level air monitoring in multiple microenvironments, GPS tracking over a relatively long duration, and proximity monitoring, each of which required unique methods for novel equipment development. Specifically, we designed and built in-vehicle passive monitoring devices that capture exposures during driving. We also designed and built proximity monitors, which record time spent in specific microenvironments (inside the residence and inside the vehicle), and we customized off-the-shelf GPS units to allow continuous location tracking for periods up to and exceeding 2 weeks.
Table 1 shows the demographic characteristics of (1) the subgroups who participated in each of the CCAR Project 5 field campaigns and (2) the complete MESA Air cohort at Exam 5. Overall, the participants in this study matched the Multi-Ethnic Study of Atherosclerosis (MESA) Air cohort as a whole well with a couple of exceptions. Sampled participants tended to be a little younger and were more likely to be employed. These differences can be attributed to our requirement that sampled participants drive at least 30 min/day on average. We also ended up with fewer Chinese participants, partly because we restricted participation to English speakers and partly because there were no Chinese participants in Winston-Salem by design in the parent MESA study.
Table 1. Demographics for Project 5 field campaigns compared with the MESA Air cohort as a whole
|
Winston-Salem |
Los Angeles |
MESA Air* |
|||
|
Winter (n = 46) |
Summer (n = 47) |
Winter (n = 47) |
Summer (n = 46) |
(n = 4920) |
|
|
Gender (%) |
|||||
|
Male |
46 |
49 |
49 |
59 |
53 |
|
Female |
54 |
51 |
51 |
41 |
47 |
|
Race (%) |
|||||
|
White |
43 |
45 |
30 |
33 |
42 |
|
Chinese |
0 |
0 |
6 |
11 |
11 |
|
Black |
57 |
55 |
19 |
15 |
26 |
|
Hispanic |
0 |
0 |
45 |
41 |
21 |
|
Age Group* (%) |
|||||
|
45-54 |
2 |
2 |
4 |
4 |
2 |
|
55-64 |
20 |
30 |
45 |
34 |
33 |
|
64-74 |
39 |
40 |
34 |
45 |
32 |
|
75-84 |
33 |
26 |
17 |
13 |
26 |
|
85+ |
7 |
2 |
0 |
2 |
7 |
|
Employed* (%) |
40 |
56 |
60 |
61 |
45 |
*At MESA Exam 5 (2010–2012).
Some characteristics of the first three exposure campaigns (Winston-Salem heating and nonheating and Los Angeles heating) were provided in the last report. The fourth and final field campaign occurred in Los Angeles from July 6 – July 31, 2014. This campaign included 46 participants (96% of goal). Of the 46 participants, 28 returned from the February field campaign and 18 were new participants. We deployed 184 Ogawa and 184 3M samplers (46 each of personal, indoor residential, outdoor residential, and in-vehicle), and measured the same pollutants as during previous campaigns. We also deployed 20 blank samples (11%) and 15 duplicate samples (11% of possible maximum, as no personal duplicates were intended to be deployed, to reduce participant burden). As with the previous campaigns, the highest concentrations for most analytes were found in the vehicle samples (Table 2). The only exception was ozone, where the highest concentration was found outside.
Table 2 presents median concentrations for all measured analytes for all four campaigns. Because SO2 was only detected in a handful of samples across all field campaigns, at levels just above the detection limit, results are not presented here. For each pollutant, between 0 and 5 samples from Winston-Salem heating, 0 and 10 samples from Winston-Salem nonheating, 0 and 5 samples from Los Angeles heating, and 0 and 8 samples from Los Angeles nonheating were invalidated due to field or laboratory error.
Table 2. Median concentrations by sampling location: residential indoors, residential outdoors, personal, and in-vehicle.
|
WS Heating |
WS Non-heating |
LA Heating |
LA Non-heating |
|||||||||||||
|---|---|---|---|---|---|---|---|---|---|---|---|---|---|---|---|---|
|
|
Out |
In |
Pers |
Veh |
Out |
In |
Pers |
Veh |
Out |
In |
Pers |
Veh |
Out |
In |
Pers |
Veh |
|
NO2 |
9.32 |
5.86 |
6.95 |
87.9 |
4.33 |
4.62 |
5.21 |
54.8 |
20.4 |
19.1 |
18.3 |
104 |
12.7 |
15.4 |
15.3 |
117 |
|
NOx |
14.4 |
13.4 |
16.7 |
114 |
5.40 |
9.89 |
12.4 |
61.7 |
43.7 |
55.1 |
57.4 |
193 |
16.6 |
19.6 |
24.4 |
83.0 |
|
Ozone |
32.3 |
0.46 |
1.55 |
29.9 |
23.3 |
0.44 |
1.30 |
17.59 |
15.7 |
0.98 |
1.55 |
13.8 |
25.9 |
4.37 |
5.75 |
39.6 |
|
pentanes |
14.5 |
38.9 |
69.2 |
304 |
21.1 |
85.5 |
204 |
786 |
40.7 |
48.1 |
58.9 |
313 |
18.2 |
22.1 |
28.7 |
245 |
|
isoprene |
0.00 |
0.02 |
0.11 |
0.03 |
0.07 |
0.07 |
0.08 |
1.90 |
0.07 |
0.07 |
0.07 |
1.77 |
0.07 |
0.07 |
0.07 |
1.81 |
|
nonane |
0.01 |
0.09 |
0.11 |
1.07 |
0.01 |
0.22 |
0.29 |
1.16 |
0.05 |
0.08 |
0.11 |
0.69 |
0.02 |
0.04 |
0.06 |
0.61 |
|
decane |
0.01 |
0.11 |
0.14 |
2.48 |
0.02 |
0.22 |
0.21 |
4.14 |
0.03 |
0.06 |
0.08 |
4.73 |
0.02 |
0.05 |
0.07 |
4.21 |
|
undecane |
0.01 |
0.21 |
0.24 |
3.97 |
0.02 |
0.21 |
0.23 |
9.33 |
0.03 |
0.06 |
0.07 |
14.1 |
0.01 |
0.04 |
0.05 |
13.5 |
|
dodecane |
0.18 |
0.07 |
0.10 |
4.38 |
0.09 |
0.18 |
0.17 |
13.3 |
0.23 |
0.05 |
0.06 |
12.6 |
0.17 |
0.02 |
0.03 |
17.8 |
|
benzene |
0.18 |
0.26 |
0.31 |
1.86 |
0.09 |
0.45 |
0.51 |
2.52 |
0.23 |
0.25 |
0.25 |
2.10 |
0.17 |
0.16 |
0.22 |
2.68 |
|
toluene |
0.21 |
1.15 |
1.55 |
8.53 |
0.23 |
3.52 |
3.72 |
20.9 |
0.62 |
0.92 |
1.16 |
7.80 |
0.41 |
0.67 |
0.94 |
8.90 |
|
m-xylene |
0.07 |
0.33 |
0.36 |
5.02 |
0.07 |
0.65 |
0.63 |
7.27 |
0.25 |
0.32 |
0.41 |
3.69 |
0.13 |
0.19 |
0.29 |
4.22 |
|
o-xylene |
0.04 |
0.14 |
0.18 |
2.52 |
0.03 |
0.31 |
0.28 |
3.46 |
0.13 |
0.16 |
0.20 |
2.01 |
0.07 |
0.10 |
0.13 |
2.23 |
For all analytes except for ozone, the highest concentrations were found in the vehicle samples. For ozone, the highest concentrations were found in the outdoor samples. After reviewing the results for all four campaigns, the results for the in-vehicle samples seem higher than expected. We are conducting experiments to ensure that we are capturing the correct sampling time for the in-vehicle samples.
In addition to the air monitoring described above, each of these three field campaigns also included an intensive location-tracking component focused on time spent in five different microenvironments: at home indoors, at home outdoors, away from home indoors, away from home outdoors, and in a motor vehicle. Time-location data were collected using three different methods simultaneously: time-location diaries, GPS tracking, and proximity monitors. In order to analyze the GPS tracking data, an automated rule-based method was developed to process the large quantity of GPS data collected. Each period of time during the monitoring campaign was classified as at home, in-vehicle, or other using this automated process.
The output from this automated processing method for GPS data was compared to the time reported in these locations on the TLD. On average, participants spent the most time at home and the least time in other locations during the winter sampling in Winston-Salem. Time spent in-vehicle ranged from 3.2 to 4.0 percent when measured by GPS only and from 4.9 to 6.2 percent when reported via TLD. The Spearman rank correlation between these two methods for each city, season and location category range from 0.61 to 0.91. Though these two methods produced similar estimates of time in each location category, several errors were identified in the GPS tracking data that could not be addressed with the automated classification procedure. Such errors were flagged and investigated; the time associated with those points was assigned to the appropriate location category using the corresponding TLD.
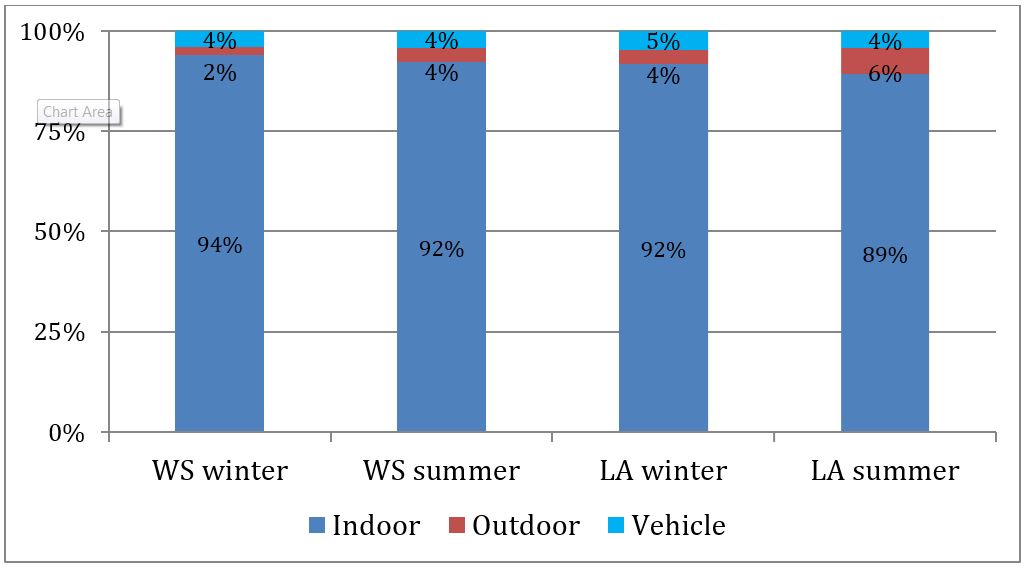
To produce the single best estimate of time-location patterns during the monitoring periods, the GPS and TLD measurements were integrated in order to capitalize on the strengths of each tool. The GPS measurements of time at home and in other locations were divided into indoors and outdoors based on proportions indoors and outdoors reported in the TLD. The GPS measurement of time spent in-vehicle was used after manual adjustment to fill in gaps in the data. On average, participants spent 4–5 percent of their time in vehicles, 2–6 percent of their time outdoors, and the remainder (89–94%) indoors (Figure 9).
Figure 9. Percent of time spent indoors, outdoors and in-vehicle by sampling campaign.
The percent of time spent indoors, outdoors and in-vehicle based on this integration of intensive 2-week measurement methods was compared to questionnaire data previously collected as part of the MESA Air study. On this questionnaire, participants were asked to describe how much time they spent in a variety of microenvironments—including at home indoors and outdoors, locations away from home indoors and outdoors, and in transit—for each day of the week during typical weeks in the summer and the winter. The best estimate was compared to reported typical time-location patterns derived from the MAQ. The magnitude of the average amount of time spent in each microenvironment, particularly time spent in-vehicle, is similar across measurement methods. A manuscript for this work is currently in progress and is expected to be submitted for publication in the upcoming months. Our group also presented these analyses, along with other results from our Project 5 exposure assessment work, during a Work-in-Progress Webinar on June 8, 2015.
Aim 3: Epidemiological Analyses
Several analyses relating to Aim 3 of Project 5 are in progress. These include analyses using the following outcomes: left ventricular myocardial mass as ascertained by MRI, arteriolar diameters as measured by retinal photography, CAC as ascertained by CT, intima-medial thickness as measured by ultrasound, and DNA methylation. Cluster membership will be used as an effect modifier of the association between NOx exposure and measurements of CAC to determine whether or not the association varies by multipollutant profile (as identified by cluster).
Much of the work for Aim 3 thus far has focused on DNA methylation. At the Center for Clean Air Research (CCAR) Scientific Advisory Committee (SAC) meeting in October, we presented results from the regression analyses regarding exposure to ambient air pollution and DNA methylation in monocytes using data from 1,207 MESA Air participants. Since that meeting, additional work has been conducted for the analyses regarding exposure to ambient air pollution and DNA methylation in monocytes using data from 1,207 MESA Air participants. For the analyses involving 2,713 expression-associated gene methylation sites and air pollution, the committee suggested using a less strict false discovery rate. To this end, we used a less stringent false discovery rate of 0.05 and identified 400 and 513 expression-associated methylation sites associated with PM2.5 and NOx, respectively.
The committee also suggested that we incorporate gene expression data into our analyses. Since all 2,713 methylation sites have previously been associated with expression of nearby genes, we were interested if gene expression of the paired transcripts of the significant air-pollution-associated methylation sites were also associated with air pollution. Of these, 190 and 191 methylation sites had paired transcripts with expression also associated with PM2.5 and NOx, respectively. The resulting significant genes participate in various cellular functions including cell morphogenesis, migration, differentiation, proliferation and apoptosis.
To gain biologic insight into genes where both DNA methylation and gene expression are associated with air pollution, we conducted pathway analyses using two publicly available databases: the Kyoto Encyclopedia of Genes and Genomes (KEGG) and Gene Ontology (GO). We conducted overrepresentation analyses comparing the set of genes where both DNA methylation and gene expression were associated with air pollution with the total 2,713 genes in the study. The analyses identified several overrepresented pathways from the KEGG pathway, including leukocyte transendothelial migration and B-cell receptor signaling pathway for NOx and Notch signaling for PM2.5. These results provide evidence that air-pollution-associated atherosclerosis may be mediated in part by aberrant gene expression driven by alterations in DNA methylation. No significantly overrepresented GO pathways were identified.
Additional analyses are underway to see if air-pollution-associated methylation sites are also associated with subclinical atherosclerosis. If so, there are plans to conduct a formal mediation analysis.
Future Activities:
We are in the process of preparing three manuscripts related to Aim 2: (1) a comparison of the three time-location measurement methods utilized in this study (draft in review by co-authors), (2) an analysis of the relative contributions of each microenvironment to overall exposure to ambient-source nitrogen dioxide, and (3) a manuscript discussing the results of all of traffic-related air pollutant sampling.
For the remainder of Year 5 and the no-cost extension year, efforts will focus on Aim 3: Epidemiological analyses incorporating the exposure information gained through Aims 1 and 2.
Journal Articles on this Report : 7 Displayed | Download in RIS Format
| Other subproject views: | All 29 publications | 15 publications in selected types | All 15 journal articles |
|---|---|---|---|
| Other center views: | All 197 publications | 94 publications in selected types | All 93 journal articles |
| Type | Citation | ||
|---|---|---|---|
|
|
Chan SH, Van Hee VC, Bergen S, Szpiro AA, DeRoo LA, London SJ, Marshall JD, Kaufman JD, Sandler DP. Long-term air pollution exposure and blood pressure in the Sister Study. Environmental Health Perspectives 2015;123(10):951-958. |
R834796 (2015) R834796 (Final) R834796C005 (2015) R834796C005 (2016) R834796C005 (Final) R831697 (Final) |
|
|
|
Chi GC, Hajat A, Bird CE, Cullen MR, Griffin BA, Miller KA, Shih RA, Stefanick ML, Vedal S, Whitsel EA, Kaufman JD. Individual and neighborhood socioeconomic status and the association between air pollution and cardiovascular disease. Environmental Health Perspectives 2016; doi:10.1289/EHP199 (Epub ahead of print]. |
R834796C005 (2015) R834796C005 (2016) |
|
|
|
Spalt EW, Curl CL, Allen RW, Cohen M, Williams K, Hirsh JA, Adar SD, Kaufman JD. Factors influencing time-location patterns and their impact on estimates of exposure: the Multi-Ethnic Study of Atherosclerosis and Air Pollution (MESA Air). Journal of Exposure Science & Environmental Epidemiology 2016;26(4):341-348. |
R834796 (2014) R834796 (2015) R834796 (Final) R834796C005 (2015) R834796C005 (2016) R834796C005 (Final) R831697 (Final) |
Exit Exit Exit |
|
|
Spalt EW, Curl CL, Allen RW, Cohen M, Adar SD, Stukovsky KH, Avol E, Castro-Diehl C, Nunn C, Mancera-Cuevas K, Kaufman JD. Time-location patterns of a diverse population of older adults:the Multi-Ethnic Study of Atherosclerosis and Air Pollution (MESA Air). Journal of Exposure Science & Environmental Epidemiology 2016;26(4):349-355. |
R834796 (2014) R834796 (2015) R834796 (Final) R834796C005 (2015) R834796C005 (2016) R834796C005 (Final) R831697 (Final) |
Exit Exit |
|
|
Sun M, Kaufman JD, Kim S-Y, Larson TV, Gould TR, Polak JF, Budoff MJ, Diez Roux AV, Vedal S. Particulate matter components and subclinical atherosclerosis:common approaches to estimating exposure in a Multi-Ethnic Study of Atherosclerosis cross-sectional study. Environmental Health 2013;12:39. |
R834796 (2013) R834796 (2014) R834796 (2015) R834796 (Final) R834796C005 (2013) R834796C005 (2015) R834796C005 (2016) R834796C005 (Final) R831697 (2013) R831697 (Final) |
Exit Exit |
|
|
Szpiro AA, Sheppard L, Adar SD, Kaufman JD. Estimating acute air pollution health effects from cohort study data. Biometrics 2014;70(1):164-174. |
R834796 (2013) R834796 (2014) R834796 (2015) R834796 (Final) R834796C005 (2013) R834796C005 (2015) R834796C005 (2016) R834796C005 (Final) R831697 (2013) R831697 (Final) |
Exit |
|
|
Young MT, Sandler DP, DeRoo LA, Vedal S, Kaufman JD, London SJ. Ambient air pollution exposure and incident adult asthma in a nationwide cohort of U.S. women. American Journal of Respiratory and Critical Care Medicine 2014;190(8):914-921. |
R834796 (2015) R834796 (Final) R834796C005 (2015) R834796C005 (2016) R834796C005 (Final) R831697 (Final) |
Exit Exit Exit |
Supplemental Keywords:
cardiovascular disease, subclinical;, Health, Scientific Discipline, Air, ENVIRONMENTAL MANAGEMENT, Air Quality, air toxics, Health Risk Assessment, Risk Assessments, mobile sources, Risk Assessment, ambient air quality, atmospheric particulate matter, particulate matter, aerosol particles, air pollutants, motor vehicle emissions, vehicle emissions, air quality models, motor vehicle exhaust, airway disease, bioavailability, air pollution, particle exposure, atmospheric aerosols, ambient particle health effects, vascular dysfunction, cardiotoxicity, atmospheric chemistry, exposure assessmentRelevant Websites:
Center for Clean Air Research ExitProgress and Final Reports:
Original AbstractMain Center Abstract and Reports:
R834796 Predictive Toxicology Center for Organotypic Cultures and Assessment of AOPs for Engineered Nanomaterials Subprojects under this Center: (EPA does not fund or establish subprojects; EPA awards and manages the overall grant for this center).
R834796C001 Exposure Mapping – Characterization of Gases and Particles for ExposureAssessment in Health Effects and Laboratory Studies
R834796C002 Simulated Roadway Exposure Atmospheres for Laboratory Animal and Human Studies
R834796C003 Cardiovascular Consequences of Immune Modification by Traffic-Related Emissions
R834796C004 Vascular Response to Traffic-Derived Inhalation in Humans
R834796C005 Effects of Long-Term Exposure to Traffic-Derived Particles and Gases on Subclinical Measures of Cardiovascular Disease in a Multi-Ethnic Cohort
The perspectives, information and conclusions conveyed in research project abstracts, progress reports, final reports, journal abstracts and journal publications convey the viewpoints of the principal investigator and may not represent the views and policies of ORD and EPA. Conclusions drawn by the principal investigators have not been reviewed by the Agency.