
Grantee Research Project Results
2013 Progress Report: Cloud Condensation Nuclei Measurements During the SENEX 2013 Campaign: Observations, Analysis and Impacts
EPA Grant Number: R835410Title: Cloud Condensation Nuclei Measurements During the SENEX 2013 Campaign: Observations, Analysis and Impacts
Investigators: Nenes, Athanasios
Institution: Georgia Institute of Technology
EPA Project Officer: Chung, Serena
Project Period: June 15, 2013 through June 14, 2016 (Extended to June 14, 2017)
Project Period Covered by this Report: May 1, 2013 through April 30,2014
Project Amount: $185,790
RFA: Anthropogenic Influences on Organic Aerosol Formation and Regional Climate Implications (2012) RFA Text | Recipients Lists
Research Category: Air Quality and Air Toxics , Climate Change , Air
Objective:
The southeastern United States is characterized by high biogenic and anthropogenic emissions and active photochemistry. The interaction between biogenic and anthropogenic aerosol is not well characterized and it contributes to the anomalous cooling trend observed in the southeast United States. With support of the EPA STAR grant, we carried out measurements of cloud condensation nuclei (CCN) data collected aboard the NOAA WP-3D during the June-July 2013 Southeast Atmosphere Study (SENEX 2013), and on the ground at the Centerville SOAS site to address the following scientific questions:
- What are the hygroscopicity, CCN activity and activation kinetics of aerosols in the southeast United States (SE US)? How do these parameters relate to aerosol chemical composition and size distribution? What is the spatiotemporal evolution of these parameters?
- How does the aerosol mixing state in the SE US change over time and distance from their sources? How does this evolution affect CCN activity, hygroscopicity, and droplet activation kinetics of aerosol?
- What are the similarities and differences of SE US aerosol compared to other locations on the globe (urban, rural, continental, remote, anthropogenic, biogenic, biomass burning)? How does the mixing of anthropogenic and biogenic aerosol precursors affect observed hygroscopicity and activation kinetics?
- What is the indirect forcing associated with SE US aerosol? How complex should the size distribution-composition-CCN-activity relationship be to adequately represent the aerosol-CCN link?
- What are the impacts of point sources (such as power plants) on the aerosol and CCN number as a function of distance from the source?
Progress Summary:
Further Development of Scanning Flow CCN Analysis
We have developed a new numerical model for the non-steady-state operation of the Droplet Measurement Technologies (DMT) Cloud Condensation Nuclei (CCN) counter. The model simulates the Scanning Flow CCN Analysis (SFCA) instrument mode (Moore and Nenes, 2009), where a wide supersaturation range is continuously scanned by cycling the flow rate over 20-120 seconds. Model accuracy is verified using a broad set of data that include ammonium sulfate calibration data (under conditions of low CCN concentration) and airborne measurements where either the instrument pressure was not controlled or where exceptionally high CCN loadings were observed. It is shown here for the first time that small pressure and flow fluctuations can have a disproportionately large effect on the instrument supersaturation due to localized compressive/expansive heating and cooling. The model shows that, for fast scan times, these effects can explain the observed shape of the SFCA supersaturation-flow calibration curve and transients in the outlet droplet sizes. The extent of supersaturation depletion from the presence of CCN during SFCA operation also is examined; we found that depletion effects can be neglected below 4000 cm-3 for CCN number.
In addition to the numerical model improvements, we have considerably improved the flow control hardware during the SFCA operation of the CCN instrument. For this, we have developed a new control system that uses an Arduino microprocessor together with an MKS mass flow controller; the whole system is aircraft-grade and mounted upon the DMT CCN instrument as an independent hardware “module” that runs in parallel with the other hardware controlling the instrument. The module is attached in a way that does not disconnect or deactivate any existing hardware, so that switching into the conventional mode of operation, if needed, is a matter of turning a valve. The new module, however, controls the flow considerably better than before and with substantial improvement in instrument performance and data quality. In addition, the Arduino and mass flow controller are responsive enough to allow scan flow profiles that are sinusoidal (instead of linear), which reduce the pressure gradients and supersaturation swings during instrument operation. The new flow profile also allows considerable data quality even during flow downscans, which historically have been discarded from analysis (Moore and Nenes, 2009). An example of data with the new module collected from the instrument is shown in Figure 1. The data show the fraction of CCN-active particles (normalized by the total number of particles present in the sampled airmass) as a function of time. The data points are colored by supersaturation, cold to warm points correspond to the range of 0.15%-0.8% supersaturation, respectively. A sinusoidal flow scan is used here.

Figure 1. Sample CCN data during scanning flow operation with new Arduino – Mass flow controller module. Data shown were collected during normal operation of our CCN instrument in SFCA mode. The data points are colored by supersaturation, cold to warm points correspond to the range of 0.15%-0.8% supersaturation, respectively.
Participation in the 2013 SENEX Campaign and Initial Analysis of Data
An important outcome of the measurements and analysis thereof will be simple and comprehensive parameterizations that link aerosol chemical composition with CCN activity and droplet activation kinetics. These parameterizations can be readily used in regional and global model (GCM) studies of the aerosol indirect effect.
CCN measurements were carried out onboard the P3 successfully using the augmented Scanning Flow CCN Analysis technique presented above; for more than 80% of the flights. A map of all the flight paths for which CCN data were collected successfully are shown in Figure 2.

Figure 2. (left) Flight tracks of the WP-3D for which CCN data were collected. (right) Installation of the CCN instrument onboard the P3, with Nenes group graduate student Jack Lin whom operated and maintained the SFCA instrument (shown in the lower left part of the picture) throughout the campaign.
Analysis of SENEX Campaign Data and Link to Other Campaigns Carried Out in the SE US at the Same Time Periods
Initial analysis of the data collected has taken place, and we have begun linking the aircraft data with ground-based measurements taken place during the SOAS campaign (in Centerville, AL) and also data collected within the context of the EPA-funded SCAPE health center. One example is shown in Figure 3; shown is the fraction of particles activating as a function of water vapor supersaturation. One notes that the two spectra in general tend to look similar (as expected, given that the air masses during the co-located measurements were the same), although the ground-based CCN tended to activate at slightly lower supersaturations than aloft. This is likely due to the growth of particles in the boundary layer from production of SOA, which tends to make more CCN. Ongoing work and analysis will of course focus on further understanding the interplay between dynamics and SOA production and their contribution to CCN production.

Figure 3. Fraction of the aerosol that is CCN-active as a function of water vapor supersaturation. The data corresponds to the flights of the WP-3D over the SOAS Centerville ground site.
Furthermore, the dataset is used to evaluate the ability of climate models to reproduce the observed size and hygroscopicity distributions throughout the SE US during the measurement period. Although agreement is not expected to be perfect, it is always useful to understand if and by how much the climate models under/over estimate CCN concentrations (and what sort of implications result from this under/over estimation), and which aspects of the aerosol-CCN link lead to discrepancies. Also important is to understand the implications of CCN prediction uncertainty for droplet number, under the particular conditions of aerosol in the SE US.
For evaluation purposes, we use the CAM 5.1 global climate model (Morales-Betancourt and Nenes, 2014) with current-day emissions of aerosol precursors and SSTs. Figure 4 displays the overlap between the WP-3D flight tracks and the 4 GCM grid cells that correspond to the SE used for the evaluation.
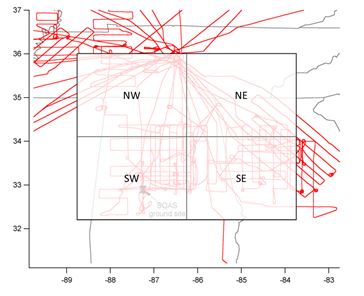
Figure 4. The overlap between the CAM 5.1 grid boxes and the WP-3D aircraft flight tracks.
To evaluate observations against models, simulations are carried out for 5 years, and averages over the summer period (for the vertical grid cell that incorporates the pressure altitudes of the P3 measurements) are computed over the last 3 years to generate predicted average size distribution and chemical composition that then are compared against the observations. All observations are used, except those that are taken very close to large point sources (power plants), as the resolution of GCMs are too coarse to capture them. Results on the measured and predicted hygroscopicity parameters for the grid cell that includes the SOAS Centerville ground site (SW grid of Figure 4) is shown in Figure 5. Although the CAM predicts a slightly different composition than the observations (mostly more organics and less sulfate), the hygroscopicity parameter ends up being captured very well. The predicted size distributions are, however, very different (Figure 5), resulting in up to tenfold lower predictions of CCN, when compared to the observations. Using the droplet calculation routine in the CAM 5.1 (Morales Betancourt and Nenes, 2014) we estimate that this level of under estimation in droplet number leads to a twofold under estimation in droplet number. This means that aerosol-cloud interactions and the resulting cloud forcing from the cloud albedo effect in the SE US may be under estimated during the summer months.

Figure 5. (left) Predicted vs. measured chemical composition for the aerosol (PM1) sampled onboard the WB-P3. The corresponding hygroscopicity parameter is indicated below each pie chart. (right) Predicted vs. measured aerosol size distributions sampled onboard the WP-3D.
Participation in the 2013 SOAS Campaign and Initial Analysis of Data
During the SOAS campaign, at the Centerville, AL site, a suite of instruments including a CCN counter, a thermodenuder (TD) and a high resolution time-of-flight aerosol mass spectrometer (AMS) were used to measure CCN activity, aerosol volatility, composition and oxidation state (Figure 6). Particles were either sampled directly from ambient or through a Particle Into Liquid Sampler (PILS) allowing the investigation of the water-soluble aerosol component.

Figure 6. Instrument setup used at the SOAS Centerville, AL site, combining a PILS, thermodenuder, CCNc, AMS, and SMPS to measure the water-soluble fraction of ambient aerosol (green dashed line) and ambient aerosol (blue dotted line).
Analysis of the data sampled showed that ambient aerosol exhibited size-dependent composition with larger particles being more hygroscopic. The hygroscopicity of thermally denuded aerosol was similar between ambient and PILS-generated aerosol and showed limited dependence on volatilization (not shown). PMF analysis for the aerosol showed that the most hygroscopic components are both the most and the least volatile features of the aerosol, with the least volatile component appearing to be the most oxidized, as expected (Figure 7). No clear relationship, though, was found between organic hygroscopicity and organic to carbon ratio, most probably because of the small range of observed O:C during this study (Figure 8). This work currently is under review in Cerully, et al. (2014)

Figure 7. κorg found for each organic PMF factor through linear regression versus O:C for non-denuded PILS aerosol at s=0.40% (left panel), where error bars represent the standard deviation. Examples of binned κorg solutions from bootstrap analysis results of the linear regression are shown on the right, where the solid and dashed green lines represent the average and one standard deviation in each factor κorg

Figure 8. Variation in κorg with O:C for ambient aerosol at s=0.20% and PILS aerosol at s=0.40% for data collected at the Centerville SOAS site. Small colored dots indicate all measured points, while larger circles and squares indicate the averages, and errors bars indicate one standard deviation in measured values for ambient and PILS aerosol, respectively. Also shown are dashed lines indicating the parameterizations of κorg with O:C from published studies.
References:
Cerully, K.M., Hite Jr., J.R., McLaughlin, M., and Nenes., A. (2014) Toward the determination of joint volatility-hygroscopicity distributions: development and response characterization for single-component aerosol. Aer. Sci. Tech., 48(3):296-312..
Raatikainen, T., Lin, J.J, Cerully, K.M., Lathem, T.L., Moore, R.H., and Nenes, A. (2014) CCN data interpretation under dynamic operation conditions. Aer. Sci. Tech., 48(5):552-561.
Moore, R.H. and Nenes, A. (2009) Scanning flow CCN analysis—a method for fast measurements of CCN spectra. Aer. Sci. Tech., 43(12):1192-1207.
Morales Betancourt, R.M., and Nenes, A. (2014) Understanding the contributions of aerosol properties and parameterization discrepancies to droplet number variability in a global climate model. Atmos. Chem. Phys., 14(9):4809-4826.
Journal Articles on this Report : 16 Displayed | Download in RIS Format
| Other project views: | All 19 publications | 19 publications in selected types | All 19 journal articles |
|---|
| Type | Citation | ||
|---|---|---|---|
|
|
Budisulistiorini SH, Li X, Bairai ST, Renfro J, Liu Y, Liu YJ, McKinney KA, Martin ST, McNeill VF, Pye HOT, Nenes A, Neff ME, Stone EA, Mueller S, Knote C, Shaw SL, Zhang Z, Gold A, Surratt JD. Examining the effects of anthropogenic emissions on isoprene-derived secondary organic aerosol formation during the 2013 Southern Oxidant and Aerosol Study (SOAS) at the Look Rock, Tennessee ground site. Atmospheric Chemistry and Physics 2015;15(15):8871-8888. |
R835410 (2013) R835410 (2014) R835410 (2015) R835410 (Final) R835401 (2014) R835401 (Final) R835404 (2014) R835404 (2015) R835404 (Final) |
Exit Exit Exit |
|
|
Budisulistiorini SH, Nenes A, Carlton AG, Surratt JD, McNeill VF, Pye HOT. Simulating aqueous-phase isoprene-epoxydiol (IEPOX) secondary organic aerosol production during the 2013 Southern Oxidant and Aerosol Study (SOAS). Environmental Science & Technology 2017;51(9):5026-5034. |
R835410 (2013) R835410 (Final) R835404 (2015) R835404 (Final) |
Exit Exit Exit |
|
|
Cerully KM, Hite Jr. JR, McLaughlin M, Nenes A. Toward the determination of joint volatility-hygroscopicity distributions:development and response characterization for single-component aerosol. Aerosol Science and Technology 2014;48(3):296-312. |
R835410 (2013) R835410 (2014) R835410 (2015) R835410 (Final) |
Exit Exit Exit |
|
|
Cerully KM, Bougiatioti A, Hite Jr. JR, Guo H, Xu L, Ng NL, Weber R, Nenes A. On the link between hygroscopicity, volatility, and oxidation state of ambient and water-soluble aerosols in the southeastern United States. Atmospheric Chemistry and Physics 2015;15(15):8679-8694. |
R835410 (2013) R835410 (2014) R835410 (2015) R835410 (Final) |
Exit Exit |
|
|
Guo H, Xu L, Bougiatioti A, Cerully KM, Capps SL, Hite Jr. JR, Carlton AG, Lee S-H, Bergin MH, Ng NL, Nenes A, Weber RJ. Fine-particle water and pH in the southeastern United States. Atmospheric Chemistry and Physics 2015;15(9):5211-5228. |
R835410 (2013) R835410 (2014) R835410 (2015) R835410 (Final) R834799 (2015) R834799 (2016) R834799 (Final) R834799C001 (2015) R834799C001 (Final) R835041 (2015) R835041 (Final) |
Exit Exit Exit |
|
|
Hennigan CJ, Izumi J, Sullivan AP, Weber RJ, Nenes A. A critical evaluation of proxy methods used to estimate the acidity of atmospheric particles. Atmospheric Chemistry & Physics 2015;15(5):2775-2790. |
R835410 (2013) |
Exit Exit |
|
|
Lee BH, Mohr C, Lopez-Hilfiker FD, Lutz A, Hallquist M, Lee L, Romer P, Cohen RC, Iyer S, Kurten T, Hu W, Day DA, Campuzano-Jost P, Jimenez JL, Xu L, Ng NL, Guo H, Weber RJ, Wild RJ, Brown SS, Koss A, de Gouw J, Olson K, Goldstein AH, Seco R, Kim S, McAvey K, Shepson PB, Starn T, Baumann K, Edgerton ES, Liu J, Shilling JE, Miller DO, Brune W, Schobesberger S, D'Ambro EL, Thornton JA. Highly functionalized organic nitrates in the southeast United States:contribution to secondary organic aerosol and reactive nitrogen budgets. Proceedings of the National Academy of Sciences of the United States of America 2016;113(6):1516-1521. |
R835410 (2013) R835400 (2014) R835400 (Final) R835403 (2015) R835403 (Final) R835407 (Final) |
Exit Exit Exit |
|
|
Lee S-H, Uin J, Guenther AB, de Gouw JA, Yu F, Nadykto AB, Herb J, Ng NL, Koss A, Brune WHi, Baumann K, Kanawade VP, Keutsch FN, Nenes A, Olsen K, Goldstein A, Ouyang Q. Isoprene suppression of new particle formation:potential mechanisms and implications. Journal of Geophysical Research-Atmospheres 2016;121(24):14621-14635. |
R835410 (2013) R835410 (Final) |
Exit Exit |
|
|
Pye HOT, Luecken DJ, Xu L, Boyd CM, Ng NL, Baker KR, Ayres BR, Bash JO, Baumann K, Carter WPL, Edgerton E, Fry JL, Hutzell WT, Schwede DB, Shepson PB. Modeling the current and future roles of particulate organic nitrates in the Southeastern United States. Environmental Science & Technology 2015;49(24):14195-14203. |
R835410 (2013) R835399 (Final) R835403 (2014) R835403 (2015) R835403 (Final) R835409 (Final) |
Exit Exit Exit |
|
|
Raatikainen T, Lin JJ, Cerully KM, Lathem TL, Moore RH, Nenes A. CCN data interpretation under dynamic operation conditions. Aerosol Science and Technology 2014;48(5):552-561. |
R835410 (2013) R835410 (2014) R835410 (Final) |
Exit Exit Exit |
|
|
Rastak N, Pajunoja A, Acosta Navarro JC, Ma J, Song M, Partridge DG, Kirkevag A, Leong Y, Hu WW, Taylor NF, Lambe A, Cerully K, Bougiatioti A, Liu P, Krejci R, Petaja T, Percival C, Davidovits P, Worsnop DR, Ekman AML, Nenes A, Martin S, Jimenez JL, Collins DR, Topping DO, Bertram AK, Zuend A, Virtanen A, Riipinen I. Microphysical explanation of the RH-dependent water affinity of biogenic organic aerosol and its importance for climate. Geophysical Research Letters 2017;44(10):5167-5177. |
R835410 (2013) R835410 (Final) |
Exit Exit |
|
|
Rattanavaraha W, Chu K, Budisulistiorini SH, Riva M, Lin Y-H, Edgerton ES, Baumann K, Shaw SL, Guo H, King L, Weber RJ, Neff ME, Stone EA, Offenberg JH, Zhang Z, Gold A, Surratt JD. Assessing the impact of anthropogenic pollution on isoprene-derived secondary organic aerosol formation in PM2.5 collected from the Birmingham, Alabama, ground site during the 2013 Southern Oxidant and Aerosol Study. Atmospheric Chemistry and Physics 2016;16(8):4897-4914. |
R835410 (2013) R835401 (Final) R835404 (2014) R835404 (2015) R835404 (Final) |
Exit Exit Exit |
|
|
Warneke C, Trainer M, de Gouw JA, Parrish DD, Fahey DW, Ravishankara AR, Middlebrook AM, Brock CA, Roberts JM, Brown SS, Neuman JA, Lerner BM, Lack D, Law D, Hubler G, Pollack I, Sjostedt S, Ryerson TB, Gilman JB, Liao J, Holloway J, Peischl J, Nowak JB, Aikin KC, Min K-E, Washenfelder RA, Graus MG, Richardson M, Markovic MZ, Wagner NL, Welti A, Veres PR, Edwards P, Schwarz JP, Gordon T, Dube WP, McKeen SA, Brioude J, Ahmadov R, Bougiatioti A, Lin JJ, Nenes A, Wolfe GM, Hanisco TF, Lee BH, Lopez-Hilfiker FD, Thornton JA, Keutsch FN, Kaiser J, Mao J, Hatch CD. Instrumentation and measurement strategy for the NOAA SENEX aircraft campaign as part of the Southeast Atmosphere Study 2013. Atmospheric Measurement Techniques 2016;9(7):3063-3093. |
R835410 (2013) R835410 (2014) R835410 (2015) R835410 (Final) R835406 (Final) |
Exit Exit |
|
|
Weber RJ, Guo H, Russell AG, Nenes A. High aerosol acidity despite declining atmospheric sulfate concentrations over the past 15 years. Nature Geoscience 2016;9:282-285. |
R835410 (2013) R835410 (2014) R835410 (2015) R835410 (Final) R834799 (2016) R834799 (Final) R834799C001 (Final) |
Exit Exit |
|
|
Xu L, Guo H, Boyd CM, Klein M, Bougiatioti A, Cerully KM, Hite JR, Isaacman-VanWertz G, Kreisberg NM, Knote C, Olson K, Koss A, Goldstein AH, Hering SV, de Gouw JA, Baumann K, Lee S-H, Nenes A, Weber RJ, Ng NL. Effects of anthropogenic emissions on aerosol formation from isoprene and monoterpenes in the southeastern United States. Proceedings of the National Academy of Sciences of the United States of America 2015;112(1):37-42. |
R835410 (2013) R835410 (2014) R835410 (2015) R835410 (Final) R834799 (2015) R834799 (2016) R834799 (Final) R834799C001 (2015) R834799C001 (Final) R835403 (2014) R835403 (2015) R835403 (Final) |
Exit Exit Exit |
|
|
Xu L, Middlebrook AM, Liao J, de Gouw JA, Guo H, Weber RJ, Nenes A, Lopez-Hilfiker FD, Lee BH, Thornton JA, Brock CA, Neuman JA, Nowak JB, Pollack IB, Welti A, Graus M, Warneke C, Ng NL. Enhanced formation of isoprene-derived organic aerosol in sulfur-rich power plant plumes during Southeast Nexus. Journal of Geophysical Research: Atmospheres 2016;121(18):11137-11153. |
R835410 (2013) R835410 (2015) R835410 (Final) R835403 (Final) |
Exit Exit Exit |
Progress and Final Reports:
Original AbstractThe perspectives, information and conclusions conveyed in research project abstracts, progress reports, final reports, journal abstracts and journal publications convey the viewpoints of the principal investigator and may not represent the views and policies of ORD and EPA. Conclusions drawn by the principal investigators have not been reviewed by the Agency.